ULI Guide for Assessing Climate Change Risk

By Byron Stigge
Published by Urban Land Institute Resilience Program, Center for Sustainability, 2015
Executive Summary
City decision makers are responsible for protecting a broad array of physical properties, economic sectors, and cultural assets from a wide variety of risks—both in the short and long term. It can be challenging to determine the magnitude of such risks, which assets and communities are most vulnerable, and where to invest limited resources.
This paper offers an analytic framework that looks at types of risks, the types of assets that need protecting, and potential damages a city may face, resulting in a guide that can be used to set priorities for developing a resilience strategy and implementing projects. Whereas ULI’s Urban Resilience Program focuses on risks related to climate change, the general process outlined here can be used for any type of risk, whether related to climate change or not. This paper is directed primarily at cities and local government decision makers because they bear fundamental responsibility for the safety and well-being of their communities. Local governments often have few resources for preparedness and planning, even though prevention is a far more cost-effective approach to sustainability than recovery after a disaster. A 2005 National Institute for Building Sciences report showed that every $1 spent on prevention saves $4 in recovery costs. The concepts and framework presented here are intended to help these decision makers—as well as any property or portfolio owner—identify and understand the risks they face. But whereas this paper is about assessing risk, it does not explore strategies to reduce risk. For more on strategies to reduce risk, see Resilience along the Rural–Urban Transect and other ULI publications at uli.org/resilience.
What Is Risk?
Risk is the product of two elements: probability and damage. In the context of climate change and cities, probability refers to the likelihood of a severe weather event or natural disaster occurring, while damage refers to the consequences such an event would have on a city’s infrastructure, economy, and people. Also called exposure, risk is a quantifiable measure that city decision makers in cities of all sizes can use in prioritizing spending, planning for future hazardous events, and ultimately beginning to mitigate the consequences of climate change.
Definition of Risk
risk = probability x damage
Risk Assessment Process
The risk-assessment process begins with a risk profile. This profile is developed by identifying the types of events that could occur in a particular city, the probability that events of varying severity will occur, and the consequences of those events, including economic, infrastructure, socio-cultural, and public health losses. Total risk is calculated by summing the values of risk associated with individual events. In general, taking action to minimize damage caused by extreme weather events is the best way to reduce exposure because the probability of a natural disaster occurring is beyond the community’s control. The analytical process summarized below begins with a look at all possible hazards. By defining specific scenarios and estimating total damages to all types of assets, a community can begin to quantify the impact of various events.
The Process
Step 1: Define types of relevant hazards Make a list of the types of hazardous events that could have a serious impact on a city or property.
Step 2: Define event scenarios For each event type, develop two to four scenarios covering a range of low to high impact of that event, then assign an annual probability of occurrence for each scenario.
Step 3: Identify affected assets For each event scenario, identify the physical, economic, and social assets affected.
Step 4: Assess the damages to each asset For each asset, estimate damages for all the types of hazards for all scenarios across all event types.
Step 5: Calculate annual risk exposure For each event type and each asset, create a risk curve, then calculate the annual risk exposure by estimating the area under the curve.
Step 6: Calculate cumulative risk exposure Perform steps 2 through 5 again to estimate scenarios, probabilities, and damages for future years, then calculate the net present value of all future annual risk-exposure values to understand the total risk a city or asset faces.
Resilience Planning Process
The risk assessment is one part of a larger resilience building process. Next, specific risk-mitigation strategies should be developed and specific projects identified using a cost/benefit analysis. These strategies and projects should be prioritized and, finally, must be implemented to address risk. Figure 1 shows where risk assessment fits into the overall process.

Applications for Risk Assessments
Comprehensive risk assessment can be helpful during a variety of planning and policy-making activities. Cities can assess which areas are most and least exposed to a variety of climate change–related risks, then direct growth and investment appropriately. Long-term plans using unbiased information can more precisely reflect anticipated impacts from rising sea levels, extreme heat, storms, flooding, and other hazards. Cities can use a quantitative risk-assessment process to inform Federal Emergency Management Agency (FEMA) Hazard Mitigation Plan documents and to support applications for mitigation grants. And, as communities and neighborhoods compete for investment, a risk assessment sends a message that the community is well informed and understands the reality of the risks it faces. Property owners will find the process outlined here and its results useful when deciding how to design or adapt a building or other asset to the impacts of climate change. Identifying all risks and calculating the total financial losses faced today based on all future annual risk exposures are the basis for a cost/benefit analysis and an assessment of mitigation alternatives. A comprehensive risk assessment essentially provides the total possible benefit in a cost/benefit calculation if a mitigation option can be designed to reduce risk from a particular type of hazardous event.
Introduction to Risk Assessment
Cities today face unprecedented and uncertain risks from climate change. This paper details a process through which cities and other property owners can assess that risk. Using this comprehensive and quantitative process, decision makers can understand the types of hazardous events and the particular assets most at risk over a long-term planning horizon so they can better address urban resilience issues now. This approach is intended to be conceptually applicable at a wide variety of scales, to a wide variety of climates, and for a wide variety of users.
Risk is a dynamic element that can change as the probability of a particular event changes or as a city’s ability to mitigate damage increases or decreases. Risk here relates to natural disasters, including hurricanes and other extreme rain or snow events, tornadoes, extreme temperatures, drought, wildfire, and earthquakes. In recent years, increased attention has been paid to natural disasters because climate change is changing the probability that they occur and their severity.
When the probability of natural disaster increases or the severity increases, the exposure of cities to risk increases in ways that are difficult to predict using historical events—the typical method used to assess risk. Better predictive models are being developed, but this uncertainty of future risk is problematic for policy makers and infrastructure planners who must make decisions about public investment that will take place over a long time horizon.
How Risk Changes: Probability and Severity
The probability and severity of hazardous events are interdependent and change together in the context of the impacts of climate change on hazardous events. For example, a location may face a low likelihood of experiencing a moderately severe storm during a given year—say, a 5 percent chance of experiencing 70-mile-per-hour winds. In that same year, it faces an even lower probability of an extremely severe storm—say a 1 percent chance of a category 1 hurricane with 90 mph winds— and a still lower probability for a category 2 storm with 100 mph winds, and so on. Probability and severity are dependent variables that correlate with one another.
It can be easier to explain how probability and severity change over time by holding one variable constant and seeing how the other changes. For instance, in 2015 a flood with a 1 percent chance of occurring might elevate water levels by 12 feet, but in 2050 a flood with 1 percent probability might raise them 14 feet. Or on the same property, the probability of a 12-foot flood might be 1 percent in 2015, but in 2050 the probability of a 12-foot flood might rise to 5 percent.
Risk assessment is particularly relevant for cities because they are increasingly vulnerable to severe events. The rising global population and massive migration to urban areas, particularly in developing countries, tends to concentrate people in coastal areas, which are particularly prone to the risk of natural disasters linked to climate change. Furthermore, many of the new urban dwellers have little in the way of financial means to recover from a disaster. As the trend toward urbanizing populations increases, so too will the importance of risk assessment and resilience planning for cities worldwide.
For a risk assessment to be more robust and socially responsible, consideration should be given to the needs of vulnerable populations. In locations where it is hard to get data, it can also be useful to speak with community groups to understand the burdens their members have faced in the past.
Several factors can overlap to increase the vulnerability of urban populations to hazards, including low income, lack of health insurance, age, disability, language ability, limited social connectivity, and others. For example, low income people might not have access to air-conditioned spaces, which would place them at higher risk in a period of extreme heat. After an event, people may have trouble finding needed resources, particularly immigrants or nonnative speakers.
A risk assessment should help cities and property owners see which types of events are most likely and which assets and communities most need support and resilience planning efforts. The risk-assessment process also often uncovers areas that need further study, for instance to better understand the effect of rising water temperatures on a fishing industry or the benefits of developing a comprehensive drought response plan.
After a risk assessment is complete, further steps help deliver comprehensive resilience projects. Community engagement provides direction from residents and businesses on their specific needs and issues. Projects, policies, and programs that reduce risk must be developed and alternatives must be weighed with a cost/benefit analysis to understand which projects lead to the greatest reduction of risk at the lowest cost. Funding and financing of climate change adaptation and risk mitigation can be limited, so creative and opportunistic solutions are often required. Projects must be designed and constructed so as to protect communities without becoming unsightly urban nuisances. And projects must be operated and maintained through many uneventful years so that they are effective when natural disasters eventually do strike.
A risk assessment such as the one presented here is one of the first and most important steps for cities in creating a more resilient community. This process is not the only way to assess risk. Appendix A lists other approaches and tools that range across a wide spectrum from more quantitative to more qualitative. It is important that a city develop a process tailored to its communities and its needs. The goal of this paper is to offer critical background information to help a city engage in an informed and comprehensive decision-making process.
Risk-Assessment Process
The process of assessing risk for a city or a specific asset is fairly linear. It starts with consideration of all possible event hazards that exist in the region. Then, by creating scenarios for each type of hazardous event and assigning a probability that that event occurs, a matrix is formed that provides the foundation for the risk assessment.
Each scenario is played out to estimate the areas of a city that will be affected, the assets that are at risk, and the level of damage to each asset during and after each event. For a city, this process can entail projecting damages to thousands of buildings, miles of infrastructure, and millions of people, so estimates must be made in order to understand orders of magnitude and scales of impact. Many different types of damages aside from simple property damage should be considered—for example, loss of business activity, temporary relocation costs, or macroeconomic impacts. Other impacts—such as loss of life or reduced investment attributable to reputation risk—may be harder to quantify, but it is crucial that they be included.
Once damages are tallied for each scenario, a curve can be drawn to graphically represent the risk profile. The area under that curve is the sum of all expected annual damages from all possible event scenarios in a given year. As the impacts of climate change on storms, droughts, and other natural hazards are better understood, the process of calculating the annual risk exposure for future years will become more precise. Current evidence suggests that climate change is increasing risk by increasing the severity or probability of some types of extreme events. The risk-assessment procedure outlined in this paper can help cities verify and quantify how climate change will directly affect them.
As the final step, the cumulative risk exposure can be calculated using net present value to provide a single value of risk for each type of hazardous event for all future years’ annual risk exposure values. This cumulative risk exposure is valuable because it allows each event type to be compared and ranked in priority. It also gives policy makers a sense of the potential benefit a city or a property might receive over time if investments are made in risk mitigation. The process of cost/benefit analysis, evaluation of mitigation options, and implementation of mitigation steps can follow on from this critical first component of risk assessment.
Steps in Risk-Assessment Process
1. Define types of relevant hazards
2. Define event scenarios
3. Identify affected assets
4. Assess the damages to each asset
5. Calculate annual risk exposure
6. Calculate cumulative risk exposure
Step 1: Define Types of Relevant Hazards
The first step of the risk-assessment process is to inventory possible hazards and determine their relevance to a particular location, both today and in the future.
Though the list may initially seem daunting, most cities and property owners quickly narrow the focus of a risk assessment according to climatic or geographic conditions specific to their location. Wildfires typically are not relevant in tropical climates; sea-level rise likely is not relevant in the mountains.
Locations may have other hazards not listed here. One danger of climate change is that not only will existing risks be exacerbated, but also new risks will develop in communities that previously have not experienced them. While rising temperatures certainly pose a challenge in warm climates, they pose a more complicated problem for cold climates where buildings may not have air conditioning. The resulting short list of relevant event types forms the basis of a risk assessment as outlined in steps 2 through 6.
Types of Hazard Events
Hazard events potentially affected by climate change
• Hurricanes
• Extreme rainfall/flooding
• Extreme temperatures
• Drought
• Wildfire
• Landslides/mudslides
• Extreme snowfall/avalanche
• Ice storms
• Dam/levee failure
• Wildfire
Other natural-hazard events
• Earthquake
• Tsunami
• Volcanic eruption
• Windstorm/tornado
• Lightning strike
Other hazard events
• Terrorist attack
• Electrical blackout
• Water supply failure
• Disease outbreak
Step 2: Define Event Scenarios
For each event type short-listed in step 1, a variety of versions of each event are possible in a given year. For example, a mild drought, an extreme drought, and a drought of historic proportions are all possible each year. Each of these event scenarios has a certain probability of playing out: the most extreme events having the lowest probability and the mildest versions having a higher probability.
An analysis can use any number of scenarios for each event type, but typically two to four scenarios will provide sufficient information to develop a reasonably accurate picture of risk for each type of event. For the following examples, three scenarios have been outlined, corresponding to different probabilities of occurrence:
• Scenario 1: high probability—10 percent annual probability, a ten-year event
• Scenario 2: lower probability—1 percent annual probability, a 100-year event
• Scenario 3: highly unlikely—0.2% annual probability, a 500-year event
Probability-Based Event Scenarios
Finding references that accurately predict the probability that a scenario will play out may be one of the most difficult components of the risk-assessment process. In the United States, a broad variety of engineering design, hazard mitigation, and risk assessment research has provided data sources for many event types. For some event types, a survey of the best available historical data may be required in order to generate probabilities for each scenario. Other event types may require a combination of historical data and probabilities with projections of event probabilities based on the impacts of climate change. Once probabilities have been determined, an event scenario matrix can be developed similar to the one in figure 2.
Considering Future Probabilities of Events
Climate change is fundamentally changing the probability of extreme events, which leads to a range of possible future event probabilities. For example, predictions of sea-level rise in New York Harbor over the next 30 years range from 11 inches to 31 inches. This range may not be relevant for land that is 20 feet above sea level, but it may be critical for land that is only two feet above sea level.
The choice of a value from this range of possibilities will depend on the goal of the risk assessment, and sensitivity analysis may be useful in making this choice. Despite the uncertainties, it is important to begin to try to quantify the increasing probability of an extreme event in order to create the most accurate risk profile.

Determined using the example of flood levels along the East River in New York City, figure 3 shows the predicted impacts (midrange estimates) of sea-level rise on stormsurge levels for three event scenarios for 2014, 2050, and 2100, as offered by the New York City Panel on Climate Change (NYCPCC), which was charged with predicting a variety of impacts of climate change on the city.

Step 3: Identify Affected Assets
In the same way that step 1 identified the possible hazards to be considered and step 2 assigned probabilities to each of those hazards, step 3 identifies what may be damaged and step 4 estimates the amount of those damages.
Direct and Indirect Impact
Damages from an event scenario can be direct or indirect. A comprehensive assessment should consider all direct and indirect impacts. Whereas direct impacts are often obvious, such as homes destroyed during a wildfire, indirect consequences are often less obvious but can be equally or more significant. An example of indirect consequences: in the event of a flood on a commercial street, a store employee will be out of work until the business repairs the shop and restores inventory, and customers return to the neighborhood. It can take months for insurance coverage to pay on a claim, and many struggling businesses simply cannot come back after a major natural disaster. Some employees may lose their jobs permanently, reducing spending in the local economy. Likewise, displacement or uninsured repair costs can saddle homeowners with major debt for years and even force them into bankruptcy.
Impact Categories
Direct Impacts
• Property damages
• Inventory losses
• Loss of business revenues
• Personal property losses
• Displacement costs
• Loss of life
Indirect impacts
• Personal debt or bankruptcy
• Reduced home values
• Higher insurance rates
• Job losses
• Loss of employee wages
• Costs associated with lost services, such as water or electrical infrastructure
• Long-term depression of local economy
• Damaged reputation of city or neighborhood leading to less long-term investment
Regional, macroeconomic impacts of catastrophes should also be considered. Although difficult to quantify, they can have significant impact on the long-term vibrancy of a community. How a city acts before, during, and after serious events can affect its reputation as a safe place to live. Cities that become known for being “risky” may experience downward pressure on property values, business activity, tax revenues, and overall economic vitality.
Identify Directly Affected Areas or Groups
Each event scenario will affect a city or a building directly or indirectly depending on its location, elevation, proximity to the hazard source, economic status, and other variables. Narrowing the study set to defined groups or spatial areas will help focus the risk analysis and provide insight into a city’s vulnerability.
For example, flooding will directly affect buildings at lower elevations, but not those at higher elevations. Within a single building, flooding will directly affect the ground floors and basement levels, and high winds may affect windows, top floors, and the roof more than the ground levels. Regionally or citywide, one can see the spatial variance inherent in events such as flooding and sea-level rise. The box above catalogs some of the factors to be evaluated for understanding spatial variance.
Factors to Consider for Direct Impact
• Elevation of building or neighborhood
• Proximity to hazard
• Demographic groups
• Building size and construction type
• Economic or industry group
For this aspect of the risk assessment, it can be useful to develop exposure maps to better understand the spatial component. Historical information will be helpful in understanding how different areas of a city will be affected by specific events, but future projections are also critical when it comes to climate change impacts. This part of the evaluation should also focus on the people and communities that may be more vulnerable or disproportionately affected by catastrophic events, such as the poor, elderly, and isolated.
Create a List of Vulnerable Assets
After determining vulnerable groups, locations, neighborhoods, or economic sectors, one can begin to identify and list specific assets within those categories (see figure 4). For each event scenario, a list of assets that will see direct and indirect impacts should be created. High-likelihood event scenarios that are not severe and have minimal impacts tend to have fewer assets at risk. Low-likelihood scenarios that represent extreme disasters tend to have a much longer list of assets at risk because the impact areas tend to be larger.
Particular attention should be paid to critical assets that provide essential background operations allowing cities to function, such as emergency response facilities and organizations, infrastructure, and operating facilities.
Response facilities and organizations—those crucial to post-event efforts—are those that will be involved in ensuring public safety, health, and recovery in the aftermath of an extreme event.

Critical infrastructure includes assets or systems that, if damaged, would have severe impacts on public health, safety, and the economy. Operating facilities are those that contribute to the functioning of a city or region and have the potential to slow down or halt recovery efforts after a major event. Locating each of these facilities on an impact map provides an added layer of understanding of the intersection of vulnerable people, places, and infrastructure.
Step 4: Assess the Damages to Each Asset
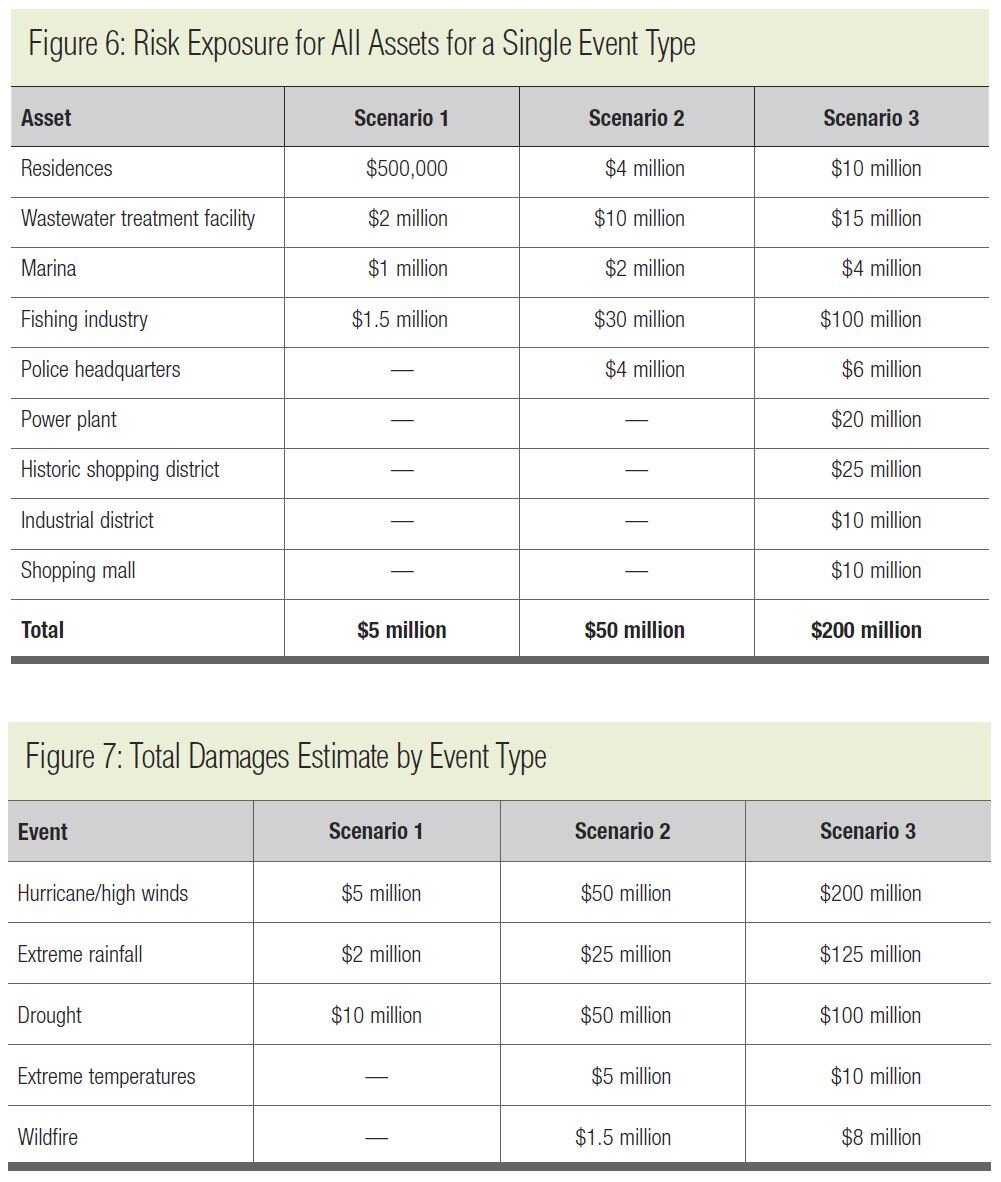
The next step is to estimate damages to each asset for each scenario for each type of event. For large, unique assets such as a pipeline, hospital, or power plant, an assessment should be conducted to estimate the amount of damage that facility will suffer during a particular event scenario. This can be done by interviewing facility managers or owners. The results of the risk assessment for that asset can be plotted as a risk curve (see figure 5). The data point for scenario 1 shows that the highprobability, low-impact event will cause nearly zero damage to the asset. As the probability of an event falls and its severity rises, the expected damages rise (see figure 6).
In the modeling of a large number of assets—thousands of homes in a hurricane-prone area or hundreds of businesses in a central business district—a typical risk vulnerability curve can be developed and applied. Vulnerability curves, or “depth-damage curves,” describe the amount of damage expected according to the severity of the event, such as wind speed, flood height, or extreme temperature. (See the appendix for a link to the Hazus modeling tool, which generates depth-damage curves for specific buildings or neighborhoods based on user inputs and available data, such as tax assessor records for building values.)
After a damage estimate has been established for each scenario, all asset damages for each scenario can be totaled to provide a total damage estimate for that scenario (see figure 7).

Step 5: Calculate Annual Risk Exposure
To determine the risk exposure for all possible event scenarios during a year, the area under the risk curve should be calculated using the data points from the three event scenarios as determined in step 4 (see figure 8). Risk curves and annual risk exposure can be calculated using modeling software, examples of which can be found in the appendix, or by using the trend line–fitting functions in software such as Microsoft Excel. Alternatively, manual calculation methods can be used. The method described below simply uses average values to block out and estimate areas under the curve.
Estimation Method
With three data points on the risk curve, the risk exposure can be estimated as shown in the graph and table on the following page. This estimation method divides the curve into rectangular areas that approximate the area under the curve (see figure 9). The results tend to be slightly overestimated, but within 10 to 20 percent accuracy. Through visual inspection, one can reduce the height of the area bars for each of the areas to find a bar that appears to better equate areas included above the curve to those excluded below the curve.
The result of the annual risk exposure value essentially provides the value of the damages a city or property would see each year if all damages from all types of events could be averaged out and evenly distributed every year. Once the annual risk exposure has been calculated for each event type, a table can be created to compare the annual risk exposure for each event type. A total annual risk exposure value can be calculated by adding all annual risk values from all the event types (see figure 10). Figure 11 demonstrates what the annual risk exposure might look like for a small town.


Step 6: Calculate Cumulative Risk Exposure
Total risk—or cumulative risk exposure—for a given event type is determined by calculating the net present value of future annual risk exposure values (see figure 12). The purpose of calculating cumulative risk exposure as a single value is to compare cumulative risk exposures for a variety of different event types, assets, or neighborhoods and determine which have the highest total risk exposure into the foreseeable future. This is different from annual risk exposure in that it accounts for how risks will change over time and includes many estimated damages for future years in a single value. Some event types will have the same annual risk year after year if the probability of the event does not change and the estimated damages from the event are not projected to change. But the probability of natural events affected by climate change will increase, as will the damages.
Interpreting the Results
The results of a comprehensive risk assessment tell the story of a city’s relative vulnerabilities in a quantifiable manner. Organizing the results into priority lists helps a city develop a more articulate understanding of its exposure to risks. The results also can provide motivation to address high-risk assets because the exposure to risk can be surprisingly high.
Risk information should inform a city’s comprehensive planning process to ensure that growth is targeted toward appropriate locations and that public investment will retain long-term value. None of the following prioritization lists gives a complete picture of risk and priority, but together they begin to paint a picture of risk in a city and can help decision makers develop a more nuanced view of which issues, areas, and facilities need the most attention.
Prioritize Event Types
As the results of a risk assessment emerge, they can be organized to understand which types of hazard events have the highest potential to affect a city or building. The hazards with quantifiable risk can be sorted purely by cumulative risk exposure, with the highest risk exposure corresponding to the highest-priority hazard. Figure 13, providing an example from a fictional city in an arid climate, describes why certain event types represent high or low risk and how climate change alters those risks. Understanding which types of event are high priority allows decision makers to focus planning efforts, funding resources, and community preparedness on the highest-priority events.

Prioritize Affected Areas
An understanding of the spatial and organizational distribution of hazards also helps cities and property owners focus attention on industries, neighborhoods, or demographic segments with the highest risk exposure. If an analysis is set up correctly, a city can be subdivided by geography, markets, and demographics in a way that allows all potential damages from all event types to be summed up for a particular area. Each area’s cumulative risk exposure can be ranked by value and a prioritization begin to emerge. Figure 14 shows an example priority list from a fictional city near a river and a mountain range.

Prioritize Vulnerable Assets
Cities have both concrete assets such as power plants, industries, and city operational facilities, and lesstangible assets key to its success, such as reputation, access to skilled labor, quality of life, and other components. Understanding the risk exposure of specific assets and prioritizing them is another way to help decision makers focus their efforts on areas where the greatest gains can be made. Figure 15 ranks both the tangible and intangible assets of a fictional city in the United States in priority.

Next Steps: After Risk Assessment
Once a clear understanding is achieved regarding the scale of risk a city or building faces, the process of planning, investing, insuring, and protecting assets can begin. Knowing which neighborhoods, facilities, populations, and infrastructure networks qualify as high-priority assets allows cities to deploy limited resources most effectively.
Though not the focus of this paper, strategies to mitigate risk, the process for a cost/benefit analysis, and key issues to consider when implementing mitigation projects are addressed in this section. Some mitigation and preparation approaches reduce risk for specific hazards, and others are useful to reduce risk and damages for all types of hazards—even those not considered in step 1 of the risk-assessment process.
Risk Mitigation Approaches and Strategies
On a property-by-property basis, many strategies may exist to reduce (or mitigate) risks. To address flood risk, for example, one could build a wall around the property, raise the property elevation, use deployable flood protection devices, buy adequate flood insurance, or relocate. There are also many community-scale infrastructure strategies, such as levee walls, floodgates, deployable structures, and breakwaters. All such mitigation measures have costs and benefits. All properties and cities have some subset of mitigation measures that are cost-effective to reduce risk. The process of identifying, prioritizing, funding, and implementing mitigation measures is the hard work of climate change adaptation and resilience-building.
Typical Types of Hazard Mitigation
• Protection and hardening
• Insurance • Relocation
• Wet flood-proofing
• Hazard preparation
Cost/Benefit Analysis
After a set of feasible mitigation projects is determined, a cost/benefit analysis can help inform the decision of which risk-mitigation measures should be implemented.
Definition of Benefit-to-Cost Ratio
B/C = net present value of all project benefits/net present value of all project costs
Project costs should include more than initial investments; costs for maintenance, operations, or upgrades should be considered and included in the calculation of the complete net present value. Project benefits are typically realized as avoided losses. They can be calculated as the difference between risk exposure for a defined “business as usual” scenario and a “with project” scenario. The ratio of benefits to costs can be used to compare the relative cost-effectiveness of a number of viable mitigation options, or it can be used determine the cost-effectiveness of a particular preferred option.
Definition of Project Benefit
Benefit = “business-as-usual” scenario risk minus “with project” scenario risk
It is important to realize that though project benefits may be most directly quantified as avoided losses, mitigation strategies may lead to competitive advantages on a regional scale. Communities that are seen as actively prepared for risks may attract additional investment. Mitigation and preparation strategies may also help spur a local industry and knowledge base related to a particular risk. For example, due to land subsidence, Norfolk, Virginia, is facing the largest amount of sea-level rise on the U.S. East Coast, but a cottage industry has developed in helping homeowners fortify and adapt their homes to this ongoing risk.
Implementation
As with other large-scale endeavors, the implementation phase for hazard mitigation can take years—if not decades—to move from concept to reality. Some of the key components are briefly described below, though each in itself could justify a significant body of guidance.
Community Outreach
The best projects seek input from residents and businesses to fully understand the needs and concerns of the community about how climate change will affect them. Engaging a community from the outset can help shape projects and gain buy-in from the people they will directly affect. In view of how directly climate change hazards can affect people, outreach is fundamental and critical to project design and implementation.
Funding and Financing
Public infrastructure is notoriously difficult to fund. Climate change impacts can put neighborhoods or even whole cities at risk, and the best risk mitigation solutions may be implemented at a neighborhood or city scale. The public good/public expense nature of infrastructure projects that reduce risks posed by climate change tend to put them in the purview of local governments, which face enormous demands on very limited financial resources.
Regulatory Approvals
Regulations developed in North America and Europe to protect public interests in waterways, public space, environmental assets, and cultural assets will apply to most large-scale climate change mitigation projects. Often the approvals process can be costly and time consuming. If regulatory requirements are understood from the outset, they can be anticipated so that progress can continue and surprises do not cause delays.
Other Issues to Consider
A common issue that arises with flood protection projects is the difficulty in having a reduction of flood risk be reflected in the premiums that businesses and homeowners pay for flood insurance. The U.S. Army Corps of Engineers recently developed a levee “certification” system in collaboration with the insurance industry so that flood insurance premiums reflect the reduction in probability of flooding offered by the levee. Other types of hazard events have less history and solutions have less maturity, making insurance companies less comfortable about predicting risk reductions.
Political interests, trends, and viewpoints change between administrations and over time, and most large-scale infrastructure projects will be implemented over multiple administrations. Setting up processes for project implementation that can operate across political cycles is a key to the successful implementation of projects aimed at adapting to climate change.
Conclusion
Climate change has shifted the landscape of risk for communities around the world. For municipal leaders, the best way to respond to this challenge is to understand the risks that their communities face.
The first step is to define all the hazards a community faces. Next, a range of scenarios can be developed for each hazard representing events with a range of probabilities and impacts. Then, physical, economic, and social assets that are affected under these scenarios can be identified. For each of these assets, potential damages in each scenario can be calculated and added up to produce a total annual risk exposure for the community. Finally, annual risk exposures can be calculated for future years and aggregated to understand the net present value of the total risk the community faces.
This risk-assessment process can help a community understand the resources it will need to invest in and how it might prioritize strategies to reduce risk. Informed and prepared communities will be more resilient to risks and will bounce back more quickly than those that are unprepared and uninformed. Building resilience starts long before disaster strikes, and this guide can help cities get started.
Read more Insights from Level Infrastructure.